

Every HR number you need, live and ready to share
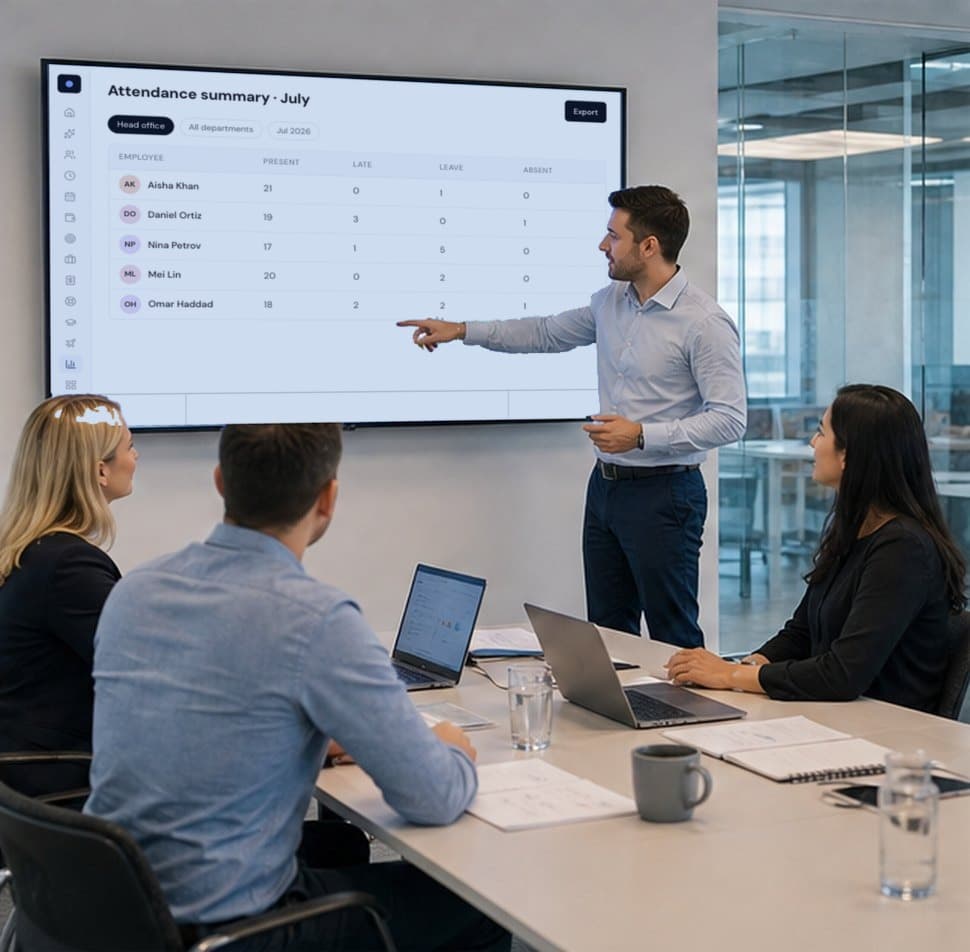
Choose from 100 live reports across HR, attendance, leave and payroll, filter them your way and export them in a click, or pin the ones you check every day to your dashboard.
- 100 live reports
- Export anywhere
- Pin to your dashboard
Why it matters
Decisions backed by numbers you trust
100 live reports and a management dashboard across people, attendance, leave and payroll. Filter them your way, export them or pin them to your dashboard, and answer the next question from leadership in minutes.
100 reports, ready to run
19 HR, 29 attendance, 6 leave, 43 payroll and 3 separation reports, all live.
A dashboard for leaders
Live attendance, payroll charts, workforce breakdowns, the org chart and trends.
Only what you may see
Every report has its own permission, enforced on the server.
01Reports
A report for every question
Run any report with filters for station, department, sub-department, group, division, status, cost centre, shift and employees, including people who have left, with date presets in your own time zone.
- 100 reports across HR, attendance, leave, payroll and separation
- Choose the columns for attendance reports, with 30+ summary metrics
- Gratuity, retirement-fund and loan ledgers
- Country-specific statutory reports
02Export and share
Print, export and share in a click
Every report can be printed or exported to PDF, Excel or CSV with your logo on it, or turned into an email summary. Employees running their own reports only ever see their own records.
- Print, PDF, Excel and CSV export
- Branded output with your logo
- Email summaries from your mail client
- Self-service reports locked to the employee's own data
03Dashboard
The numbers you check daily, pinned
The management dashboard shows live attendance with an in-and-out feed, payroll charts, workforce breakdowns, the org chart and trends. Pin any report as a bar, pie or table widget and it's saved to your account.
- Live in-and-out feed and present matrix
- Payroll charts and workforce breakdowns
- Organisation chart
- Pin any report as a bar, pie or table widget
Late arrivals by department
Bar chart · this month
Headcount by station
Pie chart · live
Payroll cost by department
Table · July
New joiners
Table · last 30 days
Run any of the 100 reports today.
Free for 24 hours
How it works
From setup to done, step by step
Set it up once with our team. After that, it runs every day on its own.
- 1
Pick a report
Choose from 100 reports across HR, attendance, leave, payroll and separation.
- 2
Filter it
By station, department, group, cost centre, shift, people and date.
- 3
Generate
Results are live, straight from the records each module writes.
- 4
Share or pin
Print, export or email it, or pin it to your dashboard as a widget.
Nexa AI
Ask Nexa for the number instead of hunting for it
Ask a question in plain words and Nexa runs the right report with the right filters, then links you to it so you can check the source.
See how the Nexa agent works“Build me a payroll cost report by location for July.”
July payroll cost by station: Head office 642,300, Warehouse 418,900, Downtown store 223,400. Report link below.
“How many people joined in the last 90 days?”
17 people joined in the last 90 days, 9 of them in Operations.
“Which department has the most late arrivals this month?”
Warehouse has the most late arrivals this month: 31, across 14 employees.
Everything included
Every detail of reports & analytics, covered
- 100 live reports
- HR, attendance, leave, payroll and separation.
- Deep filters
- Station, department, group, division, cost centre, shift and more.
- Choose columns
- Pick the columns for attendance reports.
- PDF, Excel and CSV
- Branded with your logo.
- Print-ready
- Clean printouts for meetings and audits.
- Live attendance feed
- See who's in and out right now.
- Org chart
- Your structure, drawn from the records.
- Pinned widgets
- Bar, pie or table, saved to your account.
- Per-report permissions
- Enforced on the server for every report.
One platform
Reports & analytics isn't all Nexa People does

Configurable payroll that reads approved attendance, leave and overtime, and shows its working on every payslip.

Biometric, mobile and location-verified check-ins, judged against each person's shift and ready for payroll.

Leave types, balances and multi-level approvals that keep attendance and payroll in sync on their own.
Start free today
Get the HR numbers you need, in a click
100 live reports across people, attendance, leave and payroll, filtered your way and exported or pinned to your dashboard. Start free and run any report today.
- 01100 live reports
- 02Export or pin
- 03Filtered your way
100 live reports: 19 HR, 29 attendance, 6 leave, 43 payroll and 3 separation reports.
Yes. Print any report or export it to PDF, Excel or CSV with your logo, or create an email summary.
Each report has its own permission, enforced on the server. Employees running self-service reports only ever see their own records, whatever filters are sent.
Yes. The management dashboard shows live attendance, payroll charts, workforce breakdowns, the org chart and trends, and you can pin any report as a widget.
Yes, with the Scheduled Reports module, which delivers reports on the schedule you set.